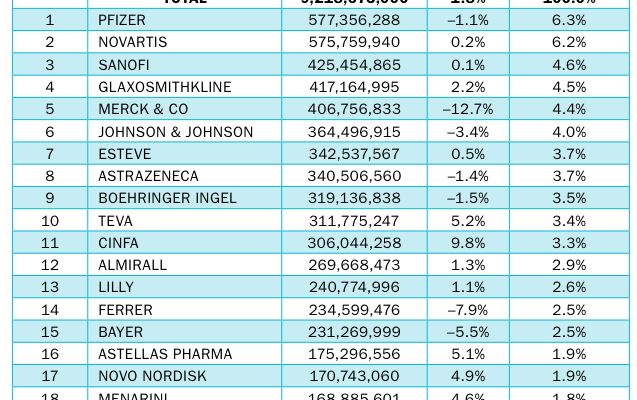
Spain The following ranking comes from April 2014, and provides a snapshot of the current top players in the Spanish pharma sector.
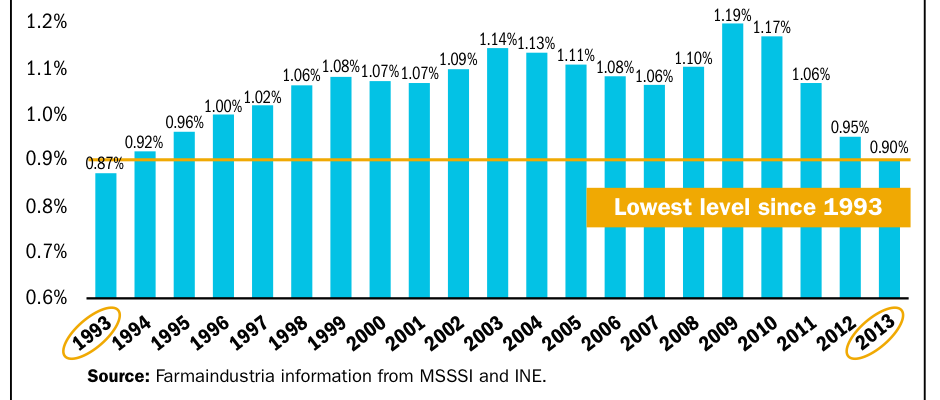
Spain Spain’s public expenditure on pharmaceuticals is today at the same level that it was in 1993 – the lowest in 20 years.
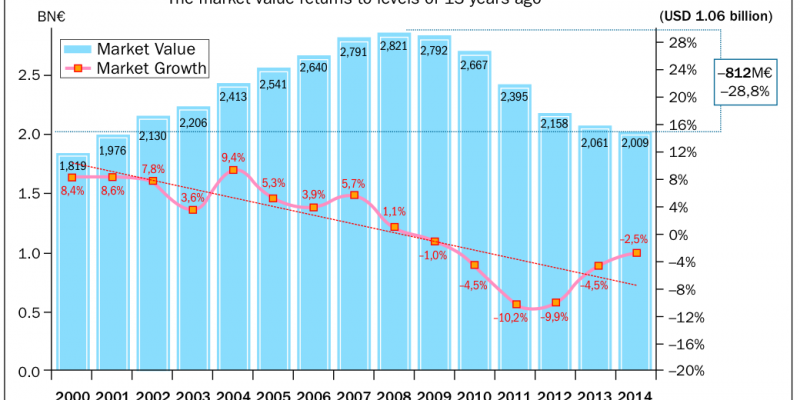
Portugal In terms of growth, the market began to show signs of improvement in 2012, overall market value has still not recovered from the recession, currently standing at around the same levels as 2002.
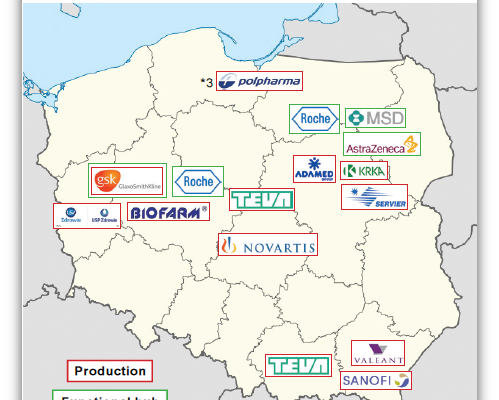
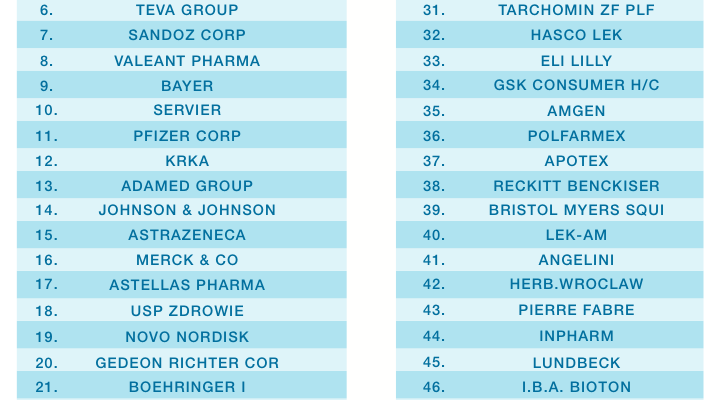
Poland Thanks to its strategic location, EU membership, and low cost base, Poland has successfully attracted investments from the global pharmaceutical industry. Today, over half of the top 30 pharma companies operating in Poland have manufacturing facilities or functional hubs (IT center, Clinical research, Shared Services, etc) in the country.
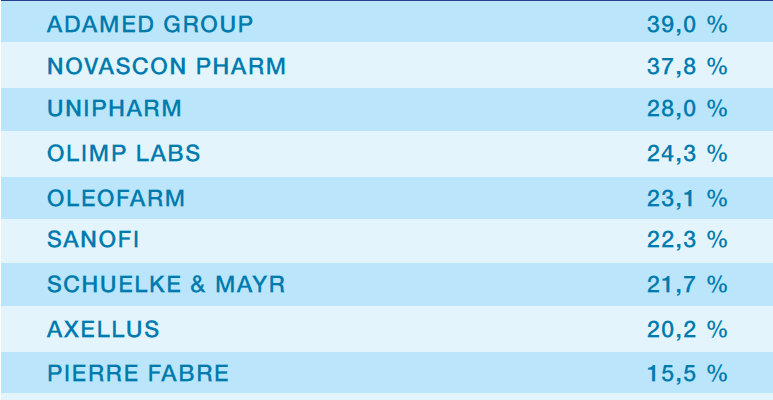
Poland Despite an overall growth slowdown in the Polish market, the OTC segment still offers many opportunities to pharma companies. Here are the top 10 OTC companies based on growth figure in 2013.
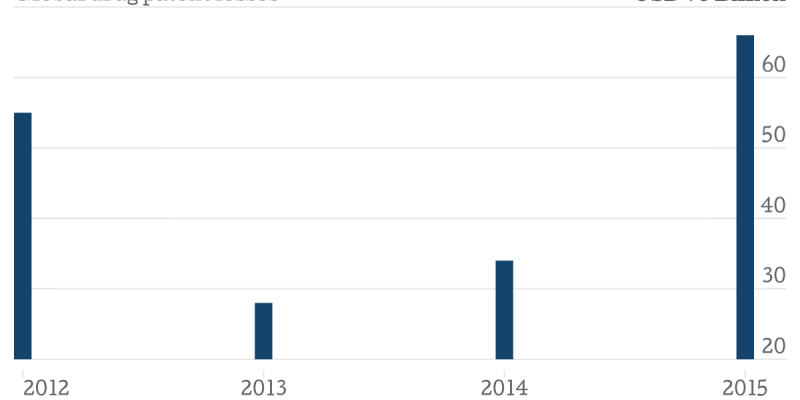
Each year, the leading innovative pharmaceutical companies around the world lose revenues when the patents on their innovative drugs expire, and generics are allowed to replace them in the market. The table below shows how much money will be lost on currently existing patents by pharma companies around the world,…
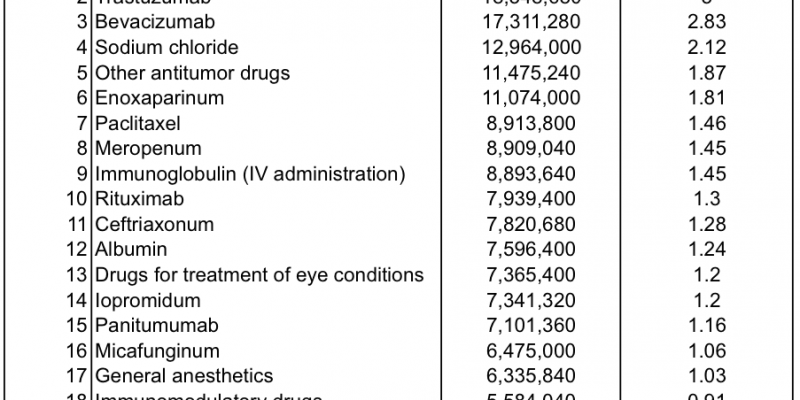
Russia This ranking for 2013 of the top 20 pharmaceutical products sold in the Russian hospital market during the year, organized by sales value, demoninates each drug according to its international nonproprietary name (INN), as denominated by the World Health Organization (WHO). Source: Pharmon / Aston Consulting
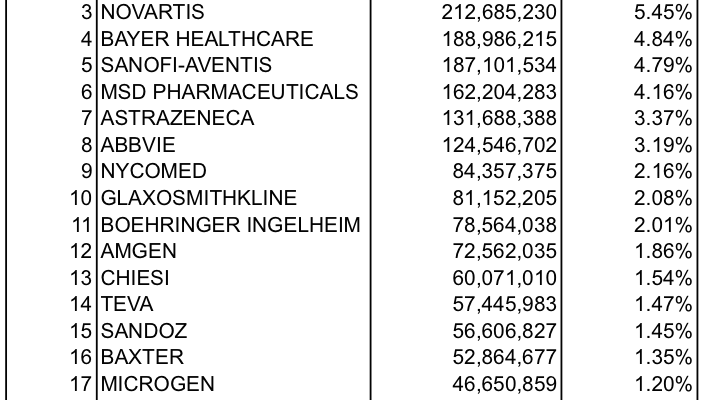
Russia As the rankings for the hospital market by sales value show, in Russia, it is multinational companies that dominate, with no local companies featuring on the top 20 ranking Source: Pharmon / Aston Consulting
Although the Polpharma group takes first place in the 2013 rankings of pharmaceutical companies in Poland when measured by sales, it is the only domestic company to make it into the top ten, which is dominated by multinationals.
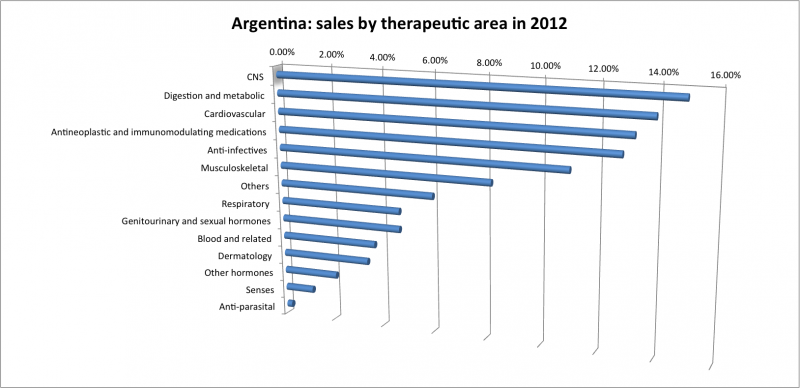
Argentina Central nervous system, metabolic and cardiovascular products were the best performing therapeutic areas in Argentina in 2012, according to the graph below, which looks at market sales broken down by therapeutic area.
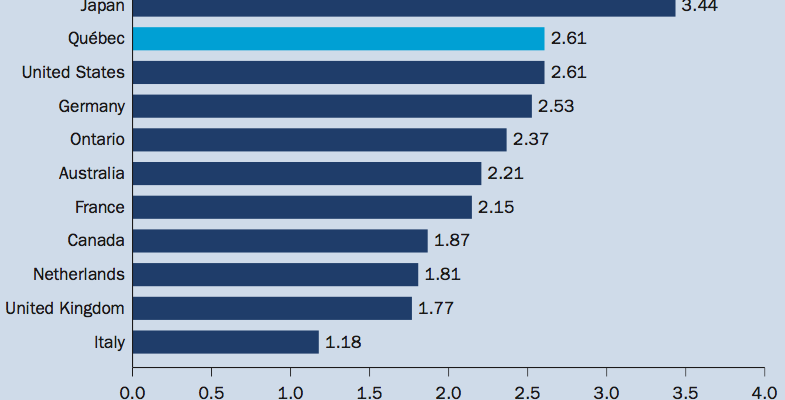
Canada This graph shows Quebec’s R&D expenditure as a percentage of GDP, in comparison to other provinces in Canada, as well as other OECD countries.
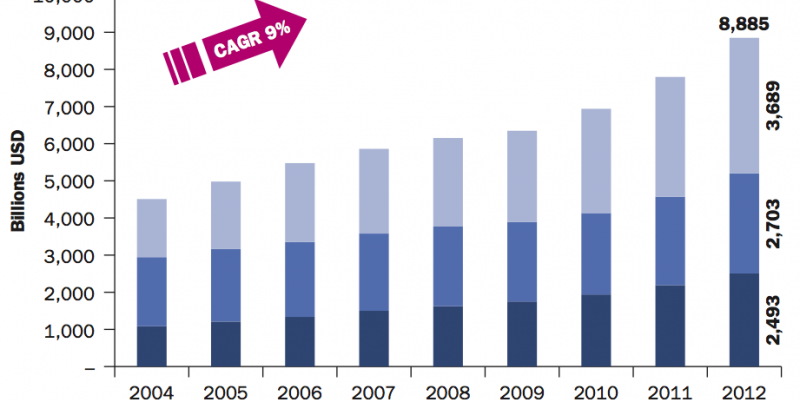
Taiwan This graph shows the revenues from the biotech sector in Taiwan between 2004 and 2012, broken down to show applied biotech, pharmaceuticals and medical devices.
See our Cookie Privacy Policy Here