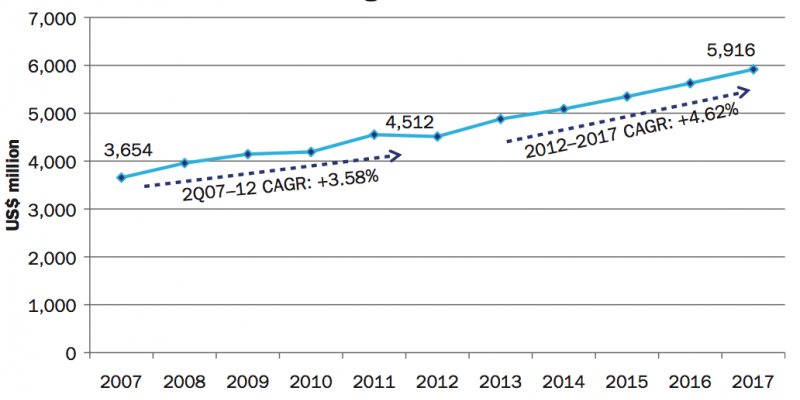
Taiwan This graph looks at the market growth in the Taiwanese pharmaceutical sector since 2007, and predicts the growth rate until 2017, estimating a CAGR of 4.62 percent.
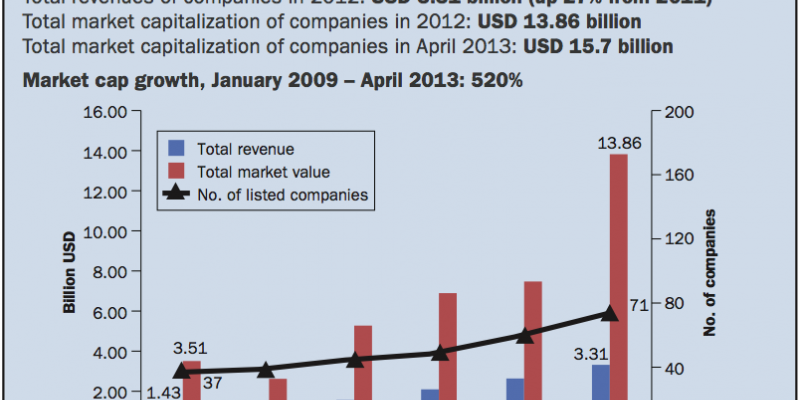
Taiwan This graph shows the total revenues and market value of the Taiwanese biotech sector between 2007 and 2013, as well as the number of listed companies in that sector over the same period.
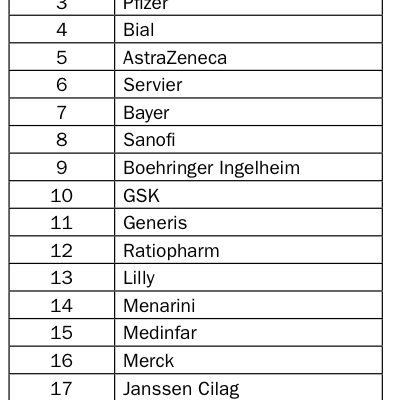
Showing figures for September 2013, this table lists the top 20 pharma companies in the Portuguese market, based on sales.
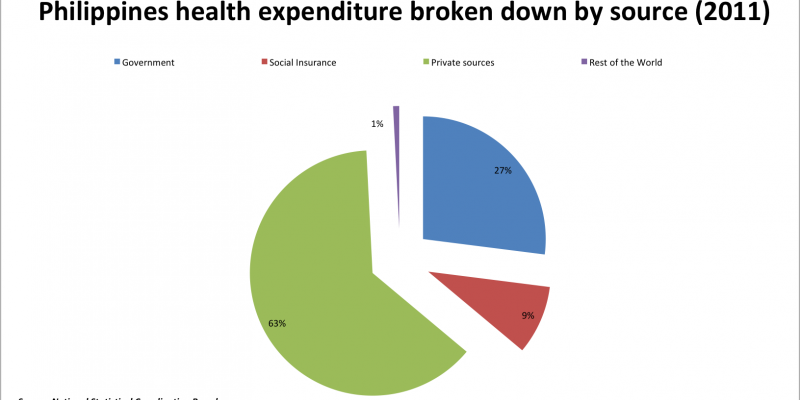
Philippines The three graphs below give a look into the performance of the Philippines healthcare industry, based upon a few key indicators: healthcare expenditure, a breakdown of total healthcare spending in recent years, and the evolution of the number of hospital beds per 1,000 patients. The first chart shows the breakdown…
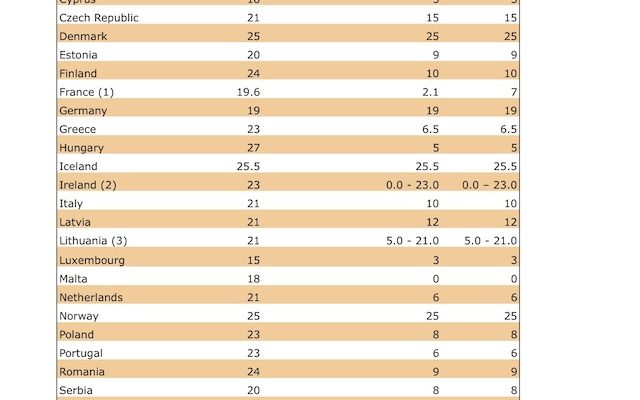
This table shows the VAT rates applied to medicines in European countries as of 1 January 2013. (1) France: reimbursable medicines 2.1%; non-reimbursable medicines 7.0% (2) Ireland: oral medication 0%; other medication 23.0% (3) Lithuania: reimbursable medicines 5.0%; non-reimbursable medicines 21.0% Source: Tax data from each country
See our Cookie Privacy Policy Here