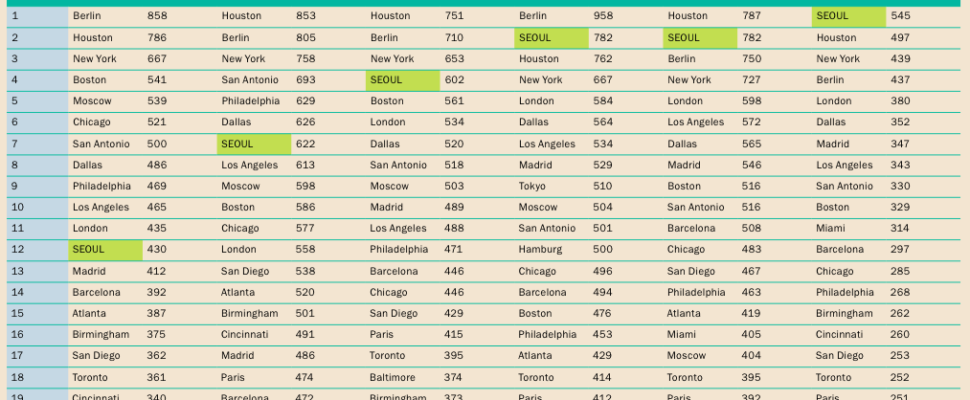
Korea The following table shows how Seoul has risen through the ranks of cities around the world to become the most competitive city for clinical trials of pharma products in 2012.
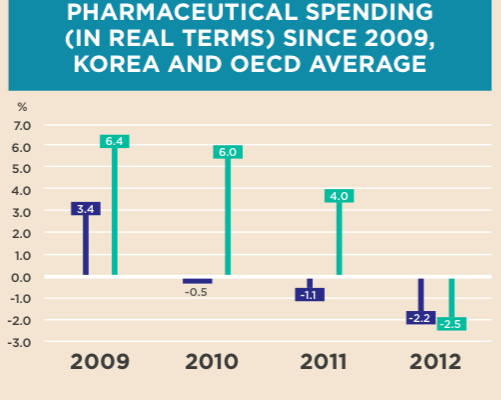
As the following graph shows, Korea’s annual growth of pharma spending in real terms dropped ahead of the rest of the OECD.
Korea Compared to the OECD average growth rate for healthcare expenditure, Korea’s growth in expenditure on medicines has remained fairly flat, dropping to zero growth in 2010 for example.
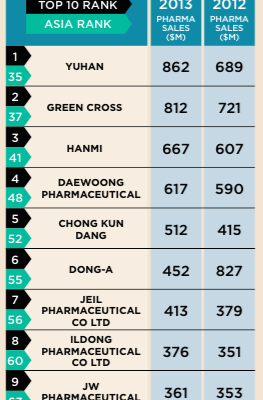
Korea Rapid overview of South Korea’s top ten pharma companies within the larger Asian context. The largest South Korean company, Yuhan, ranks 35th in Asia, with a turnover of U$ 862 million in 2013. For more data and stories from South Korea, download our latest 2015 free report here
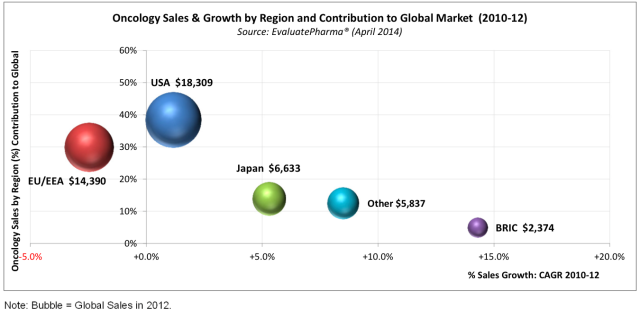
Oncology The following graph shows the comparitive spending on oncology products between 2010 and 2012 in the US, the EU, Japan, BRICs and other countries.
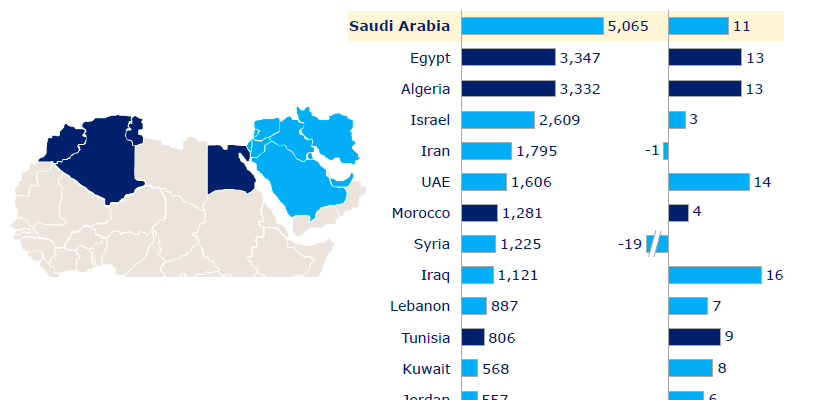
Egypt The table below shows highlighted markets in the MENA region, and their performance in 2013. Saudi Arabia is the largest pharma market in the region, with Iraq as the fastest growing market.
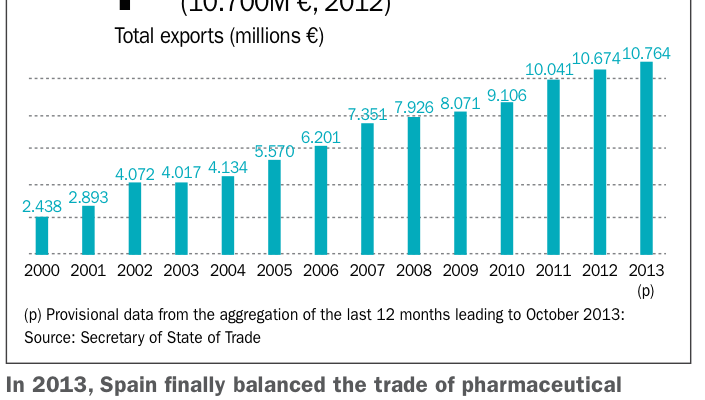
The following graph shows the rise in pharmaceutical exports from Spain, which is now the fourth largest export sector in the country.
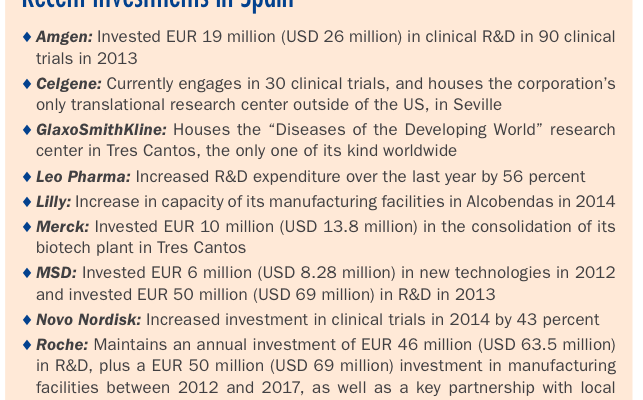
Spain Spain has seen a number of investments in recent months in the pharmaceutical sector: below is a non-comprehensive list of R&D, manufacturing, and clinical trials by international pharma companies.
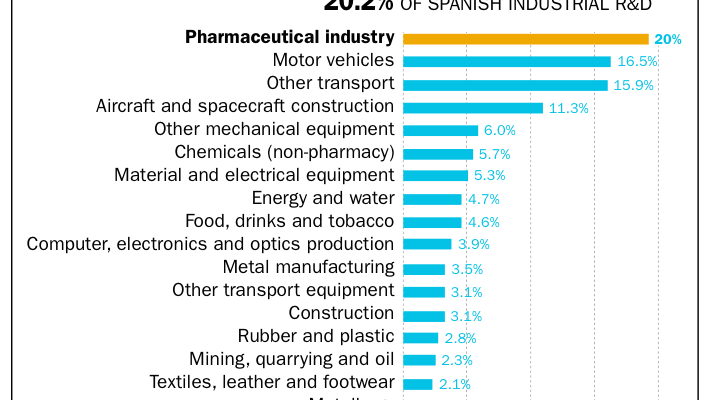
Spain The following graph shows that the pharma is the leading sector when it comes to R&D in Spain, accounting for 20.2 percent of investment in 2013.
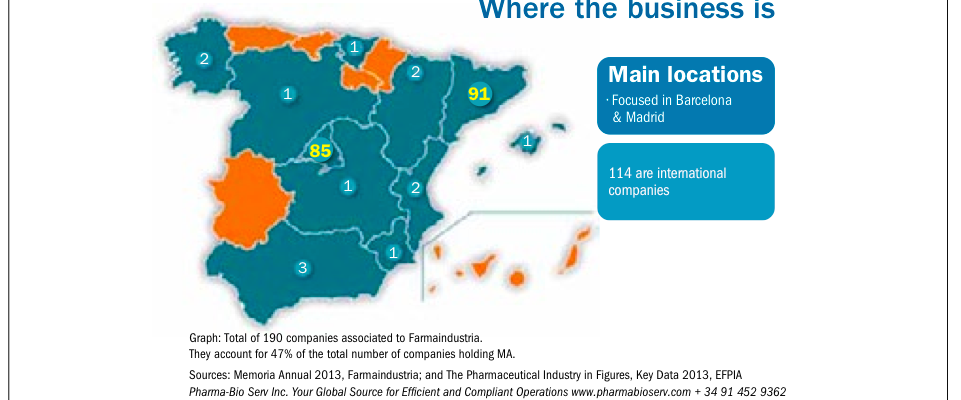
Spain The following infographic shows the main locations of the pharma sector in Spain, as well as the number of companies based in each region of the country.
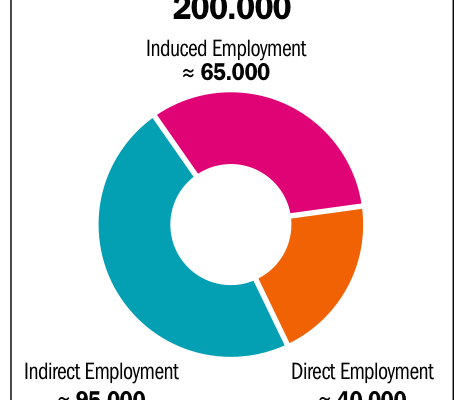
The following chart shows the direct, indirect and induced employment by the pharma sector in Spain in 2013, a total of 200,000 people.
See our Cookie Privacy Policy Here