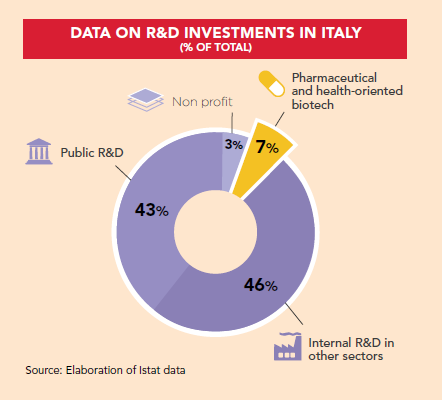
Pharma The below chart shows the sources of funding for R&D investment in Italy, with only 7% of total investment originating from pharmaceutical and health-oriented biotech. Click here to read more articles and interviews from Italy, and to download the latest free pharma report on the country.
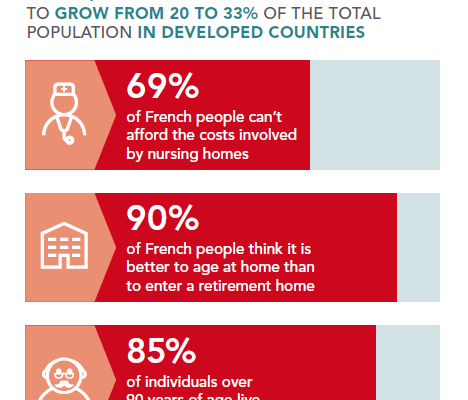
Health The chart below illustrates the potential for a shift in healthcare provision towards home care in France; a country with a rapidly increasing over 60 population, an expensive nursing home system, and a culture of living at home into old age. Click here to download the latest free pharma report on…
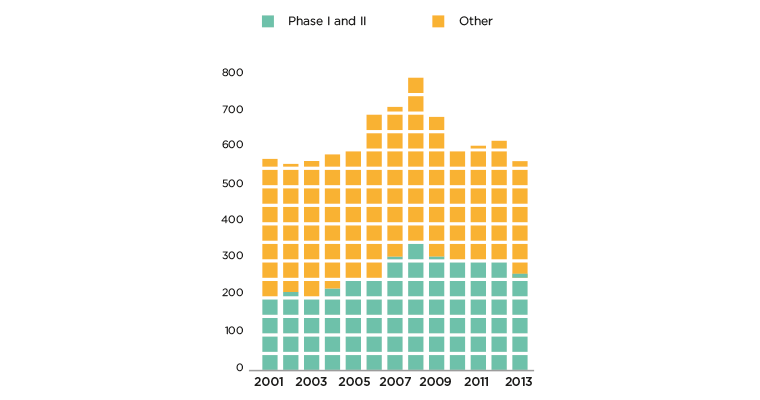
Pharma The following chart shows the number of clinical trials in Italy per year. Peaking in 2008 and slumping slightly shortly after, the numbers have returned to robust levels with 550+ trials in total in 2013 and 250+ important Phase I and II trials. Click here to read more articles and…
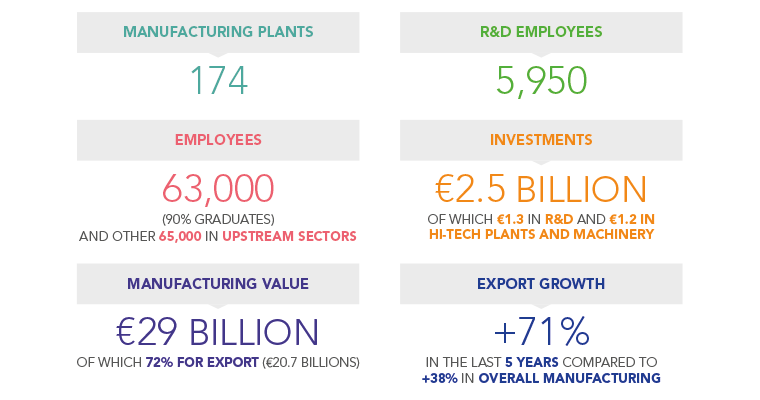
Pharma The following chart gives the key statistics on the Italian pharmaceutical industry; from number of manufacturing plants, to investments and export growth. Click here to read more articles and interviews from Italy, and to download the latest free pharma report on the country.
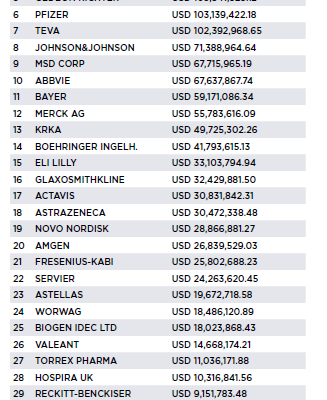
Pharma The following chart shows the top pharma companies in Hungary ranked by sales value. Global giant Novartis leads the way with USD 240 million of sales, followed by domestic champion Egis with USD 150 million. Click here to read more articles and interviews from Hungary
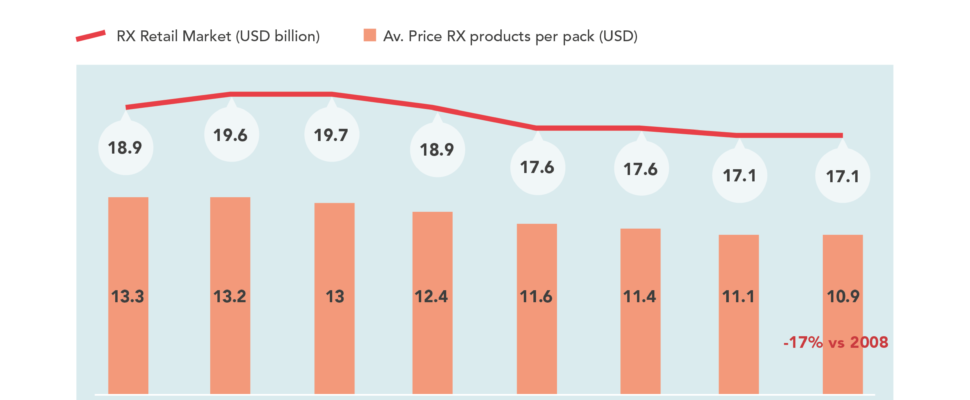
Pharma The following chart shows the decline of the RX retail market in Italy since 2008, along with the 17% decrease in the average price of RX products per pack in 2015 from 2008. Because of the rise of generics, new chemical entities are often restricted to non-retail channels. Click here…
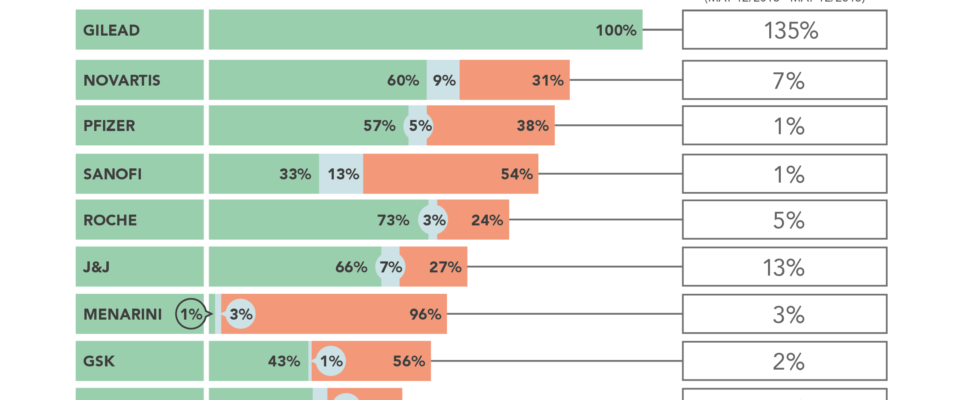
Pharma The following chart shows the leading innovators in Italian pharmaceuticals. Gilead leads the way with 135% growth, all of which comes from the hospitals sector. Click here to read more articles and interviews from Italy, and to download the latest free pharma report on the country.
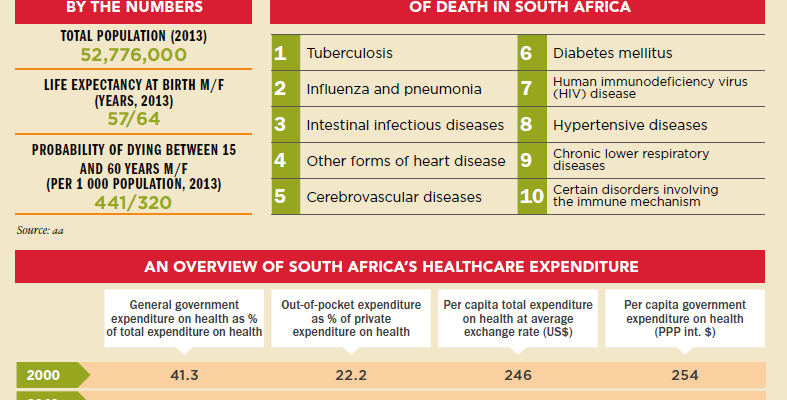
Pharma The following statistics provide an overview of South Africa’s healthcare environment, including population, life expectancy, ten leading causes of death, and healthcare expenditure. Click here to read more articles and interviews from South Africa, and to download the latest free pharma report on the country.
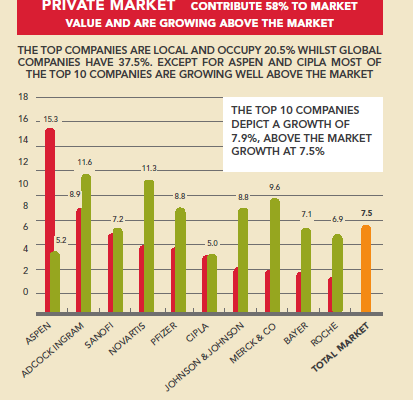
Pharma The following chart shows the top 10 corporation in the South African pharma market. Domestic champions Aspen and Adcock Ingram lead the way in terms of market share and most of the top 10 are growing well above the market average. Click here to read more articles and interviews from…
Pharma The following chart illustrates the various bottlenecks restraining the development of France’s pharmaceutical industry, including lack of investment, fewer new molecules than other European countries, disappointing performance in biological drugs, and long waiting times for drug approval. Click here to read more articles and interviews from France, and to download the…
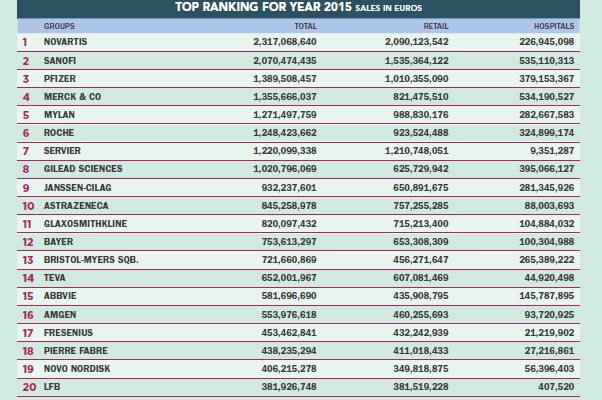
Pharma The following chart shows the top 20 pharma companies in France, ranked by sales for the year 2015. Global giant Novartis leads the way, followed by national champion Sanofi, and American titan Pfizer. Click here to read more articles and interviews from France, and to download the latest free pharma…
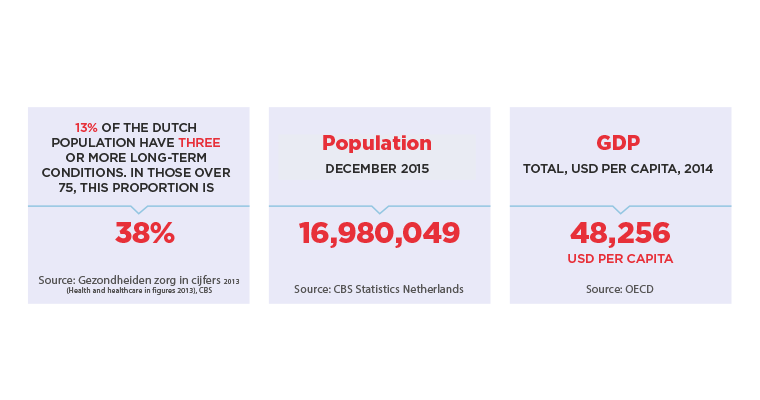
Pharma The following chart shows the massive potential in the Dutch pharmaceuticals and healthcare markets; a population of almost 17 million with high per capita GDP where a large percentage of the population have long-term health conditions. Click here to read more articles and interviews from the Netherlands, and to download…
See our Cookie Privacy Policy Here