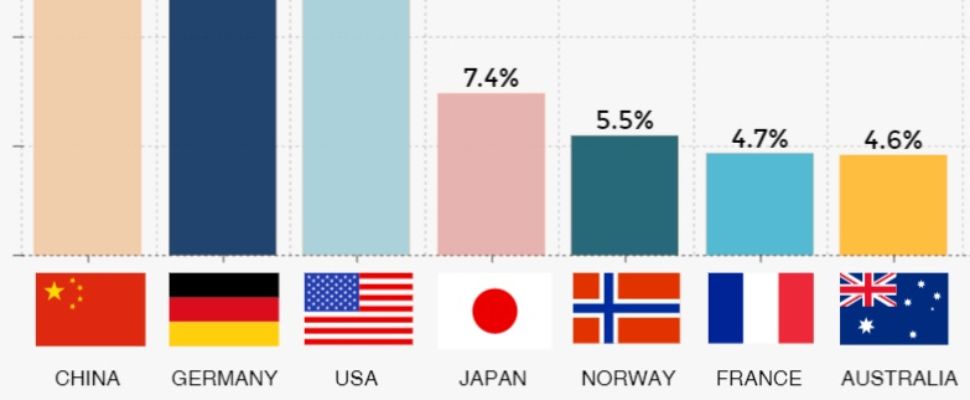
Sweden Sweden’s top pharma export destinations. China is the largest single recipient of Swedish-made pharmaceuticals, followed by Germany and the USA. Made with Visme Infographic Maker The countries from which Sweden imports the most pharmaceuticals. Germany is top, followed by neighbouring Denmark, then the USA. Made with Visme Infographic Maker…
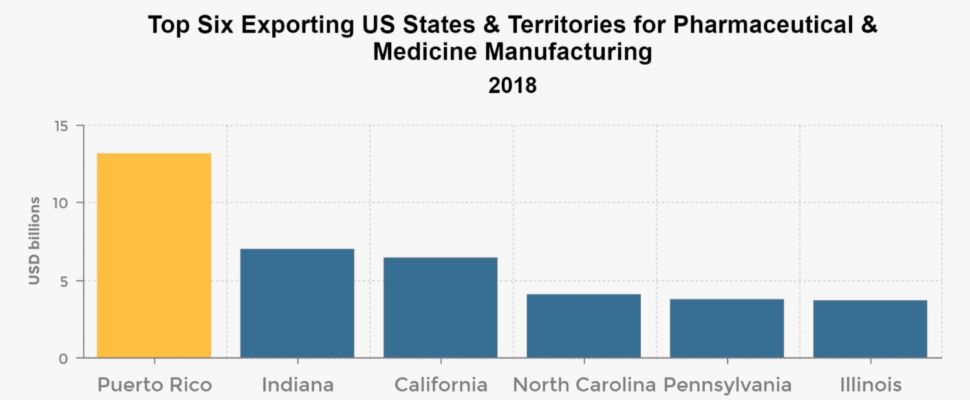
Puerto Rico Puerto Rico is far in the lead as the US state or territory that produces the most pharmaceutical products for export. The island’s export output of USD 13.2 billion in 2018 is almost double that of second-placed Indiana at USD 7 billion. Made with Visme Infographic Maker Pharmaceuticals are…
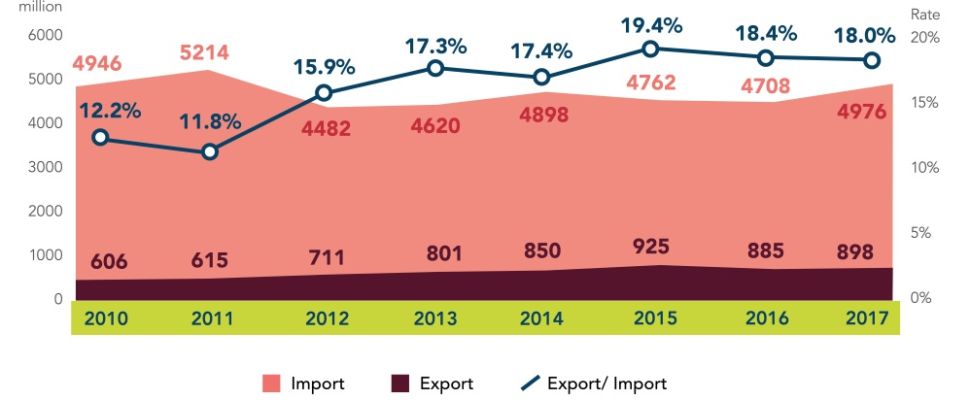
Turkey Imports and exports in Turkish pharma between 2010 and 2017. Pharmaceutical exports grew to a total of USD 898 million in 2017. These charts show both the volume and value of imported and locally-produced drugs in the Turkish pharma market between 2010 and 2017. TL 13.33 billion (USD 2.57…
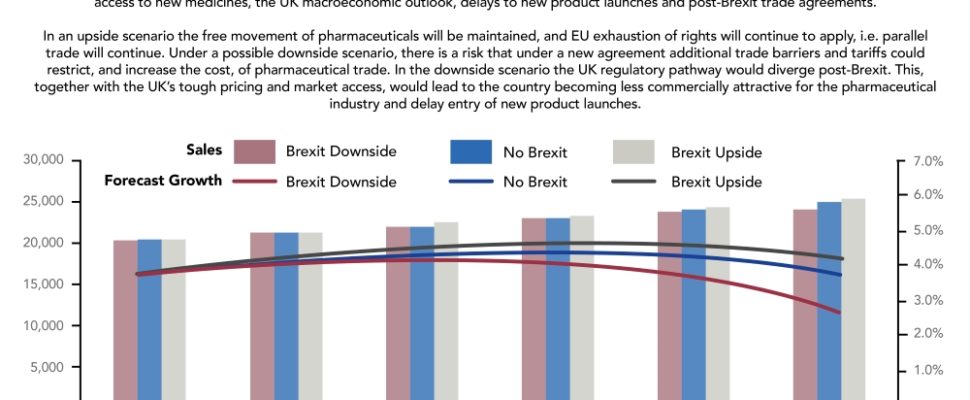
UK There is much debate surrounding the potential impact on the UK’s life sciences industry of the country’s decision to leave the European Union. Here, IQVIA analysis posits ‘upside’ and ‘downside’ Brexit scenarios on pharmaceutical market sales and growth in the UK in comparison to a theoretical ‘No Brexit’ scenario. Different…
Malta Malta has the second largest pharma trade balance per capita in the EU, the tenth in total, and was the continent’s fastest growing pharma exporter between 2001 and 2016. Malta acts a flight hub for southern Europe, with 35,000 international departures and arrivals per annum. Doing business in Malta is…
Poland The value of Poland’s pharmaceutical exports shot from USD 501 million in 2005 to USD 3.475 billion in 2015, a total growth of an astounding 590% and a compound annual growth rate of 21%. Most exports go to Europe (80%) but Asian markets are becoming increasingly important to Poland and…
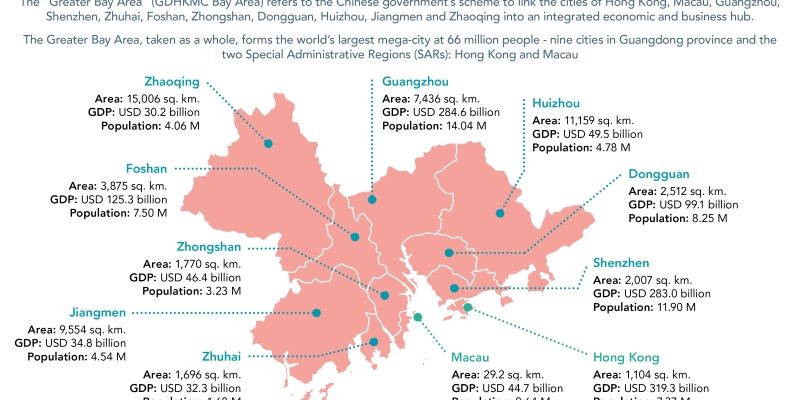
China The Greater Bay Area (several cities in Guangdong Province in mainland China along with Hong Kong and Macau) is a major Chinese government scheme to link the entire region into an integrated economic and business hub . The Greater Bay Area, taken as a whole, dwarfs the world’s other major…
Pharma India leads the way in terms of the sheer volume of US FDA-approved manufacturing plants with over 100, compared to only 28 in China. In terms of the global competitiveness of Brazil, Russia, India, China and South Africa (BRICS), China remained out in front between 2012 and 2015, with India…
Serbia Serbia macroeconomic factsheet including data on population, GDP, education and life expectancy. Serbia has risen 50 places in the World Bank’s ‘Doing Business’ rankings from 93rd in 2014 to 43rd in 2018. Serbia’s GDP per capita between 2008 and 2016. International comparison of healthcare spending growth and GDP growth between…
Tunisia Tunisia’s GDP percentage change year on year. After suffering a major slump in 2011, the economy is now on the road to recovery. In terms of ease of doing business, Tunisia lags behind the UAE and Morocco but fares better than Jordan, Egypt and Lebanon. Public spending accounts for…
Ukraine Healthcare expenditure as a share of GDP has shrunk dramatically in Ukraine since 2013. Hospitals bear the brunt of primary care in Ukraine. WHO standards require a far greater role for family doctors within the overall healthcare system. Life expectancy in Ukraine lags behind that of its neighbors and peers.…
Colombia Colombia macroeconomic snapshot. Colombia GDP 1996-2016. GDP growth in South Americabetween 2015 and 2018. Colombia stands out for economic reliability in a region of uncertainty. Per capita healthcare expenditure in Latin America; Colombia stood in 9th place in 2014. Colombia healthcare snapshot. Healthcare expenditure in Colombia up until 2021. Pharma…
See our Cookie Privacy Policy Here