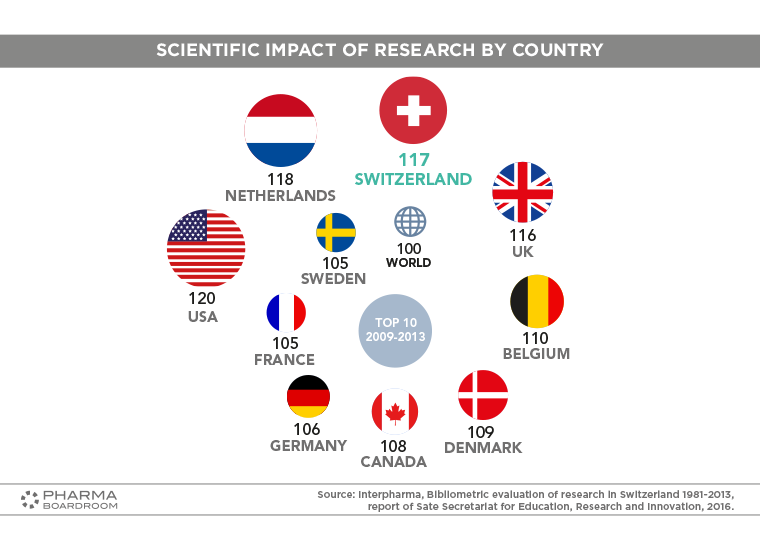
This chart shows the scientific impact of research by country, as compiled by the Swiss State Secretariat for Education, Research & Innovation. Switzerland lies in third place globally, behind only USA and the Netherlands.
This graph shows the Swiss innovation system ranked in comparison with the countries of the EU. Switzerland comes out on top, ahead of Sweden and Denmark.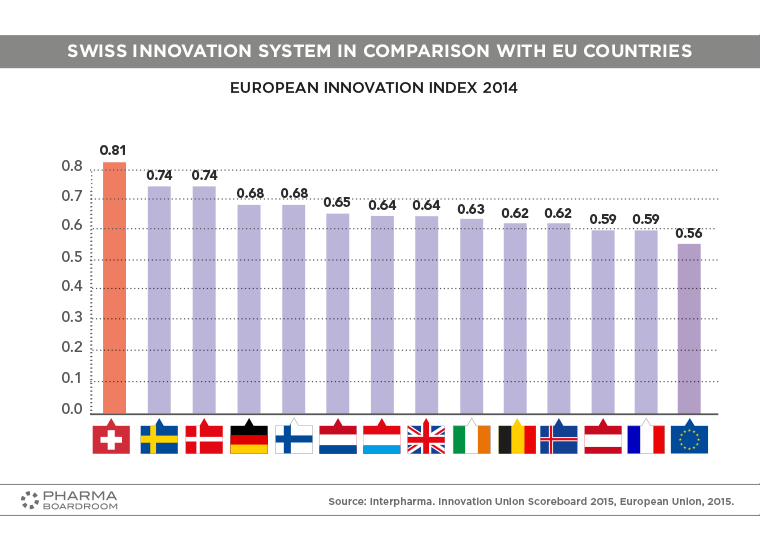
This chart shows the Swiss pharmaceutical market value in terms of pharmacies, self-dispensing doctors, hospitals, and drugstores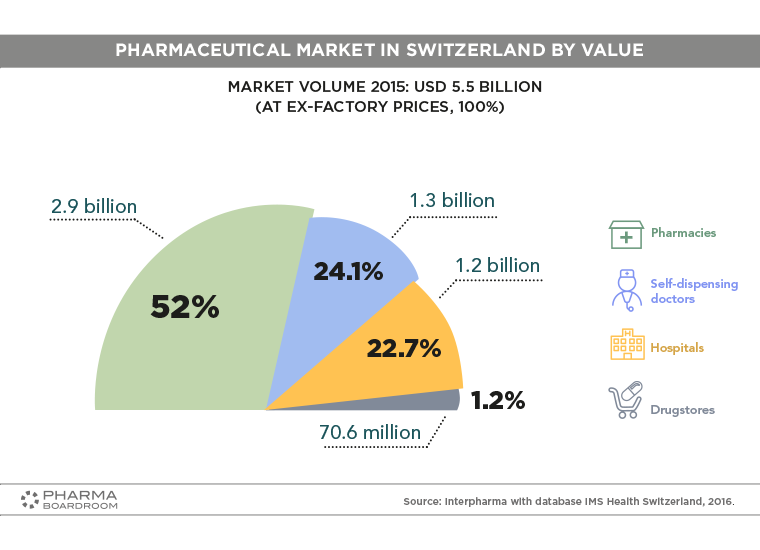
This graph clearly illustrates the rise of generics in the Swiss market, from USD 269.2 million in 2005 to 656.5 million in 2015.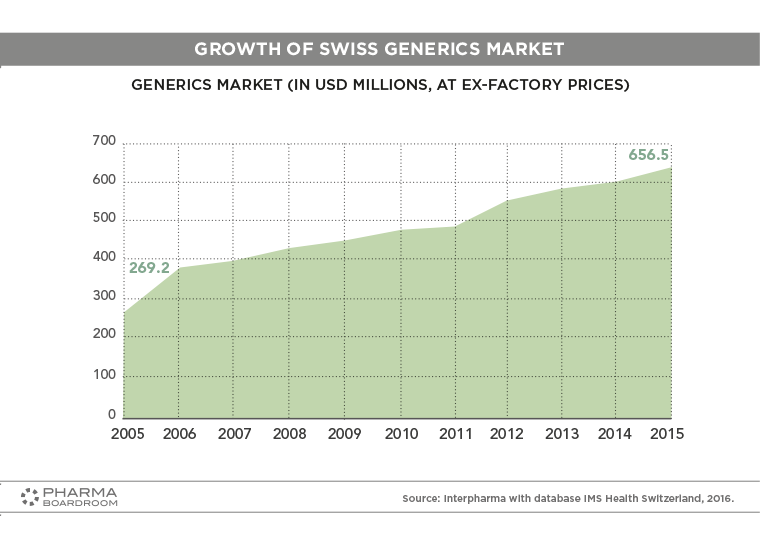
This chart illustrates the stratospheric rise of the Swiss biotech market, from a measly USD 15.5 million value in 1990, to the 957.4 million it stood as in 2015.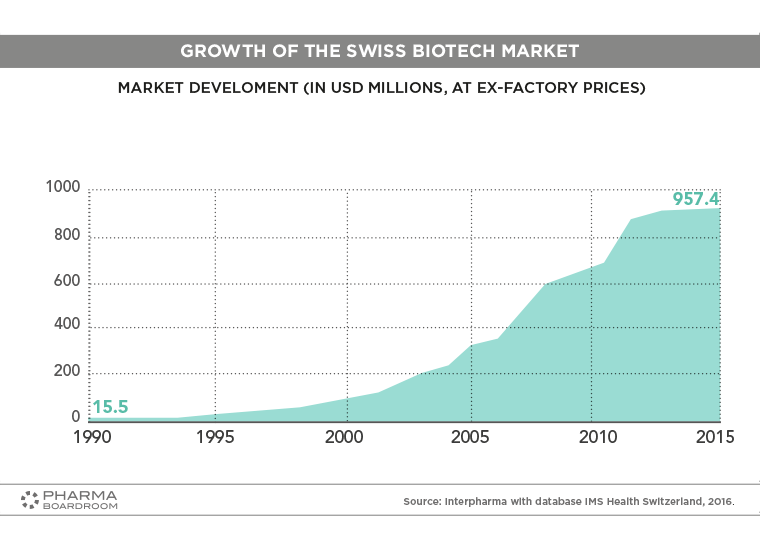
In tandem with the rise in popularity of more affordable generic drugs (see above), medicines in general are steadily decreasing in price in Switzerland, as shown in the below graph.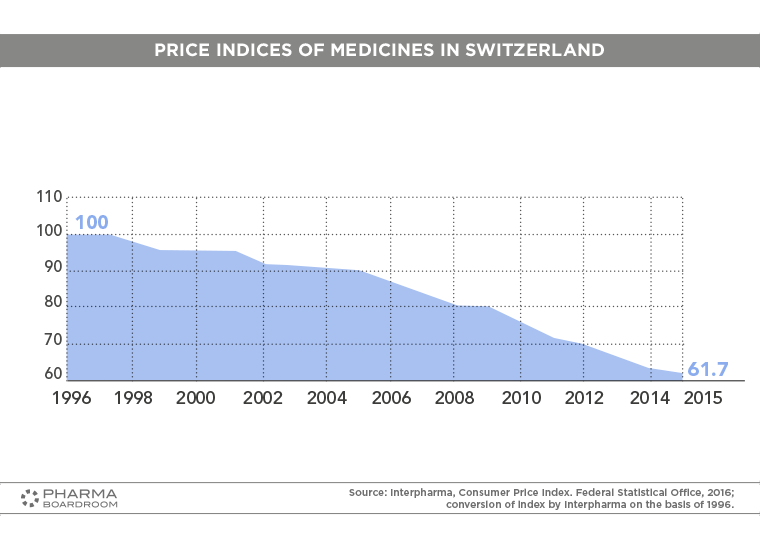
The Top 5 Pharmaceutical companies in Switzerland by number of employees.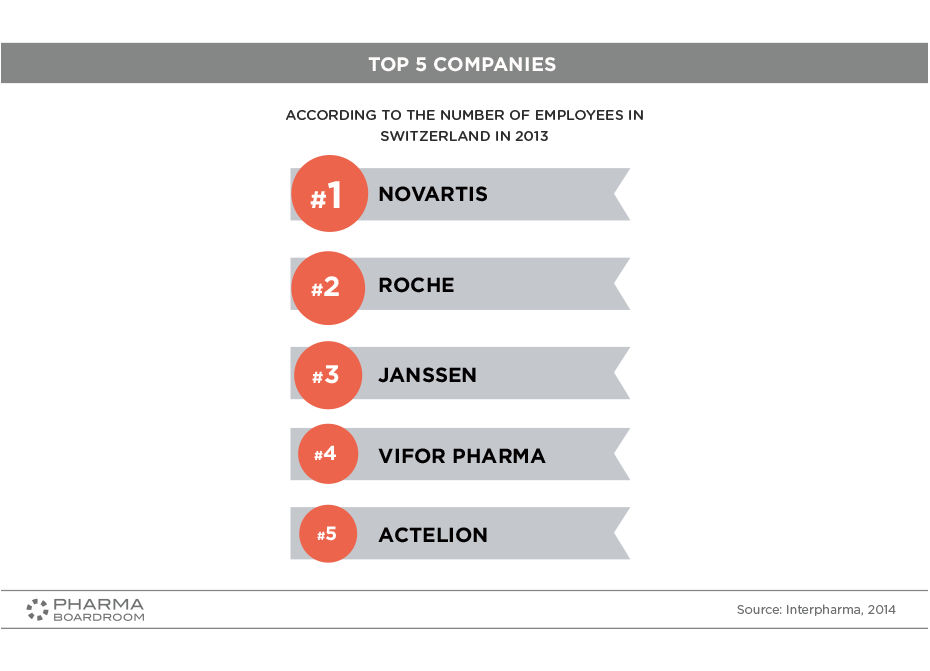
Swiss exports by industry 2001-2016.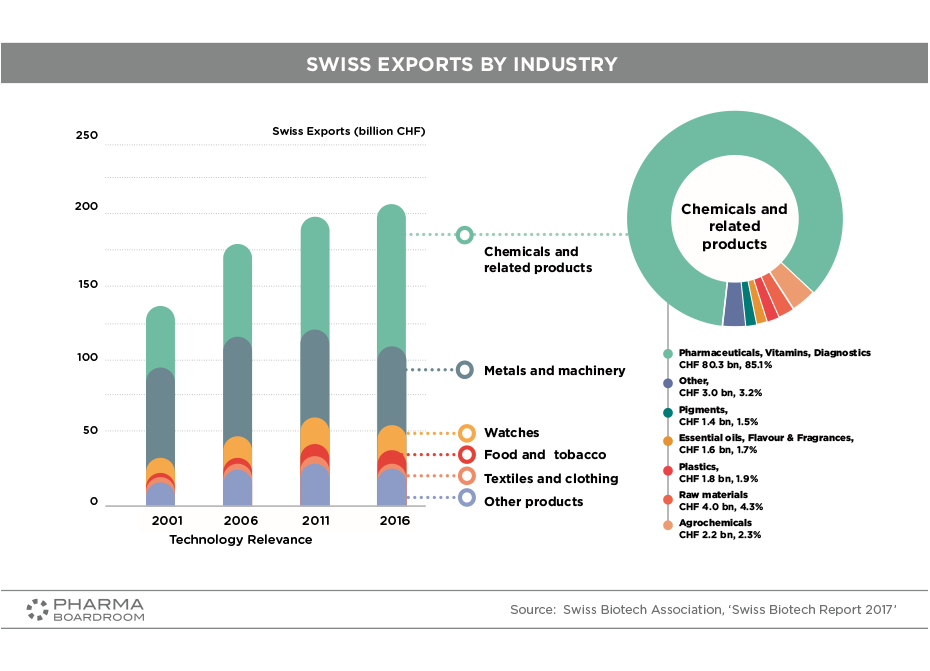
R&D expenditure in Switzerland and abroad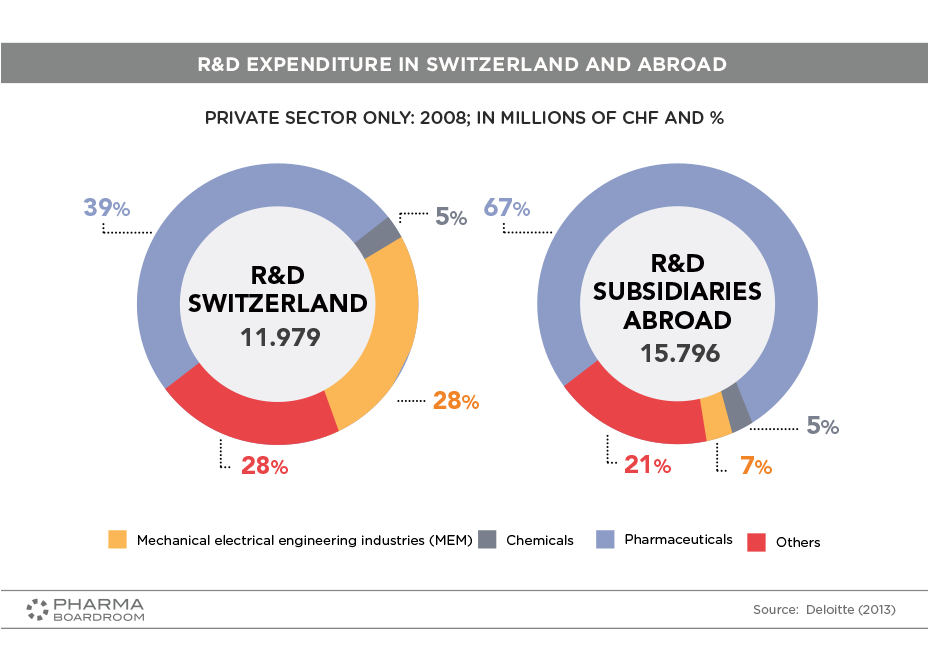
Investment in R&D by industry. Pharma leads the way.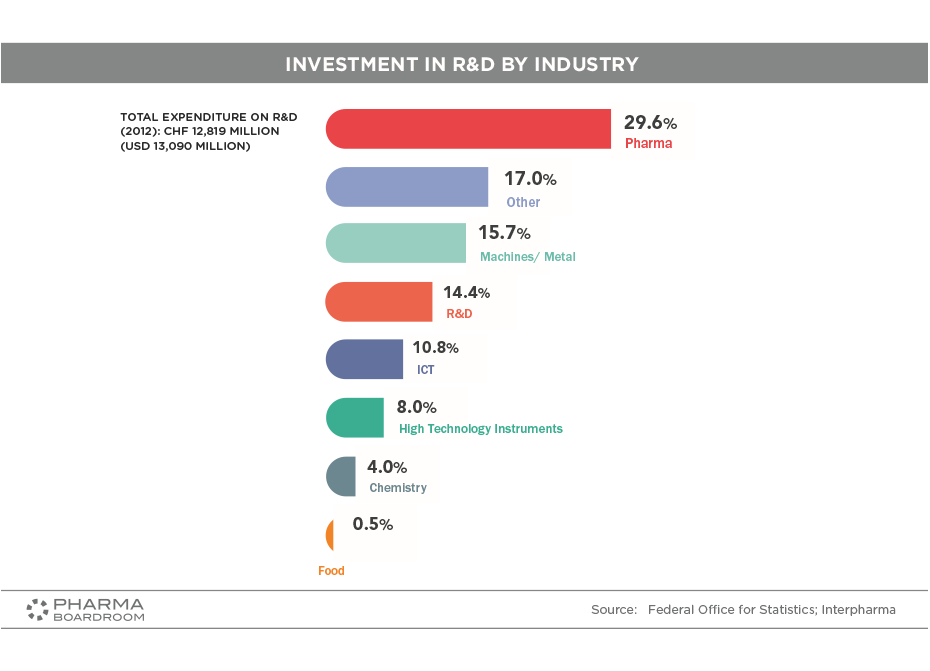
Patents: An international comparison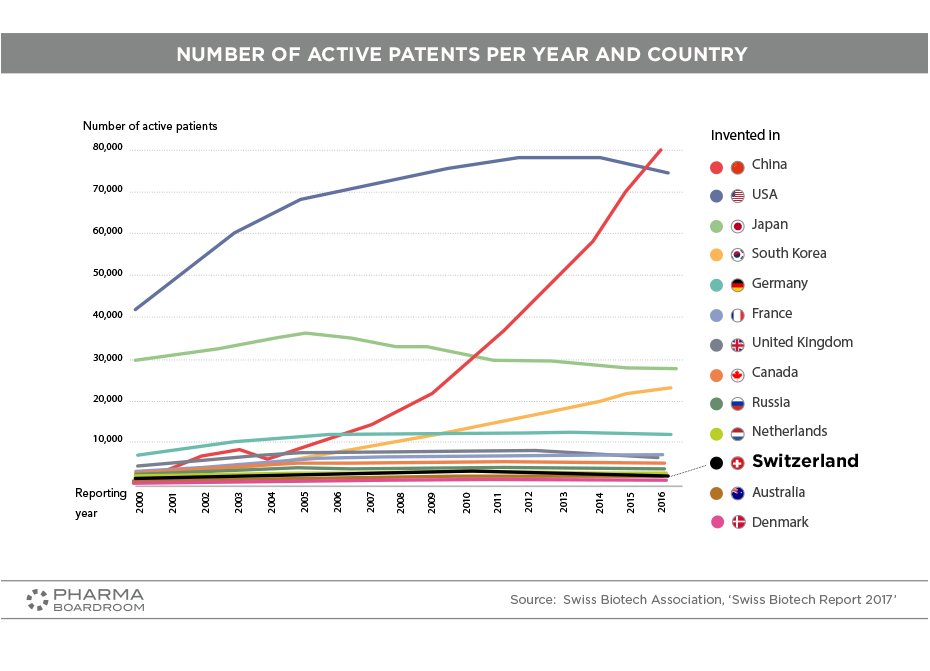
The number of biotech companies in Switzerland steadily increased from 2007 to 2016.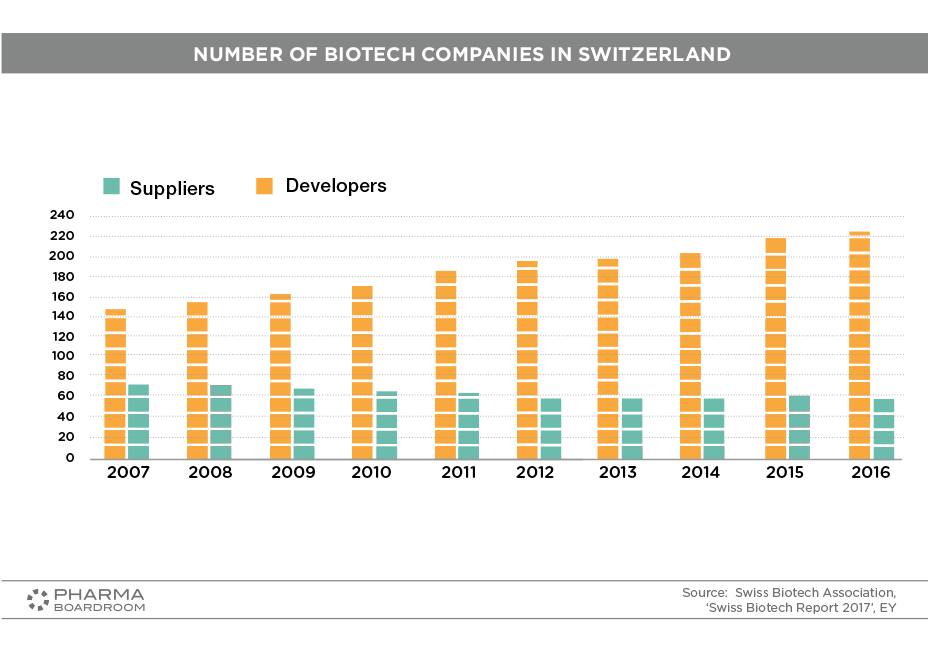
Switzerland's biotech and pharma clusters and hotspots.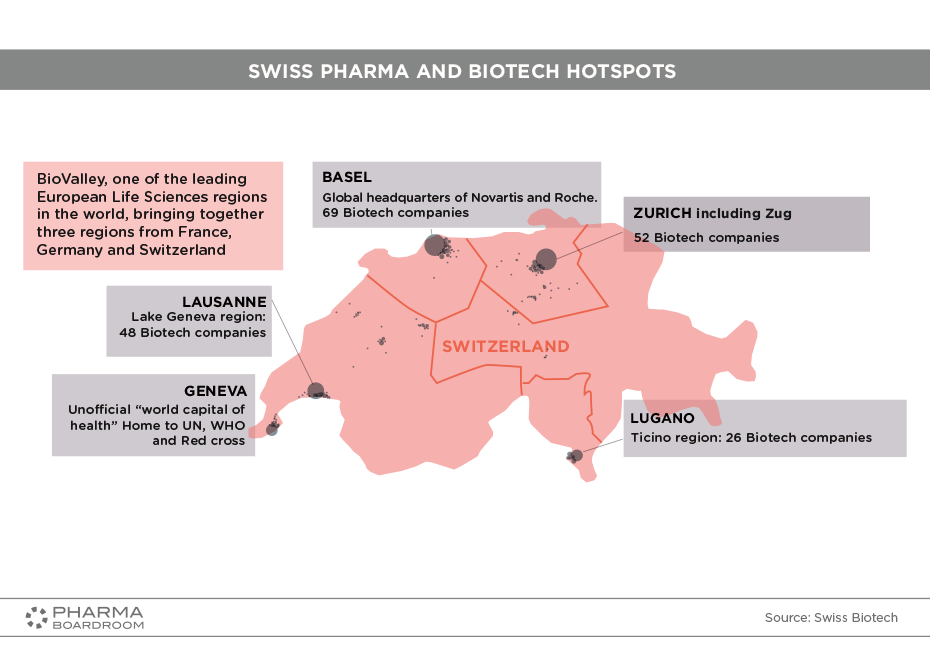
The indications for Swiss biotech products: oncology remains the leading indication.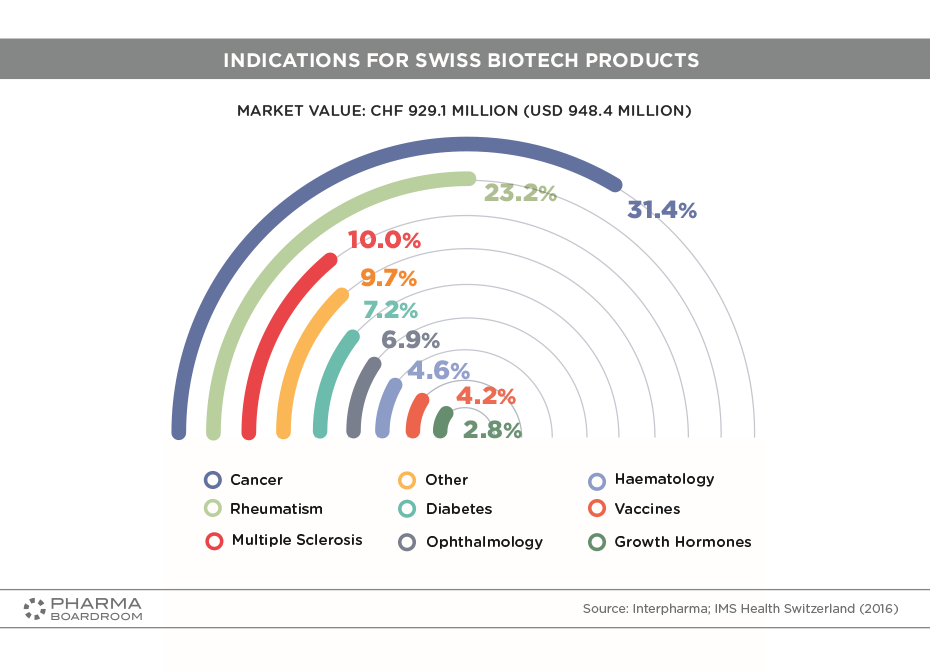
Capital investment in Swiss biotech companies between 2007 and 2016.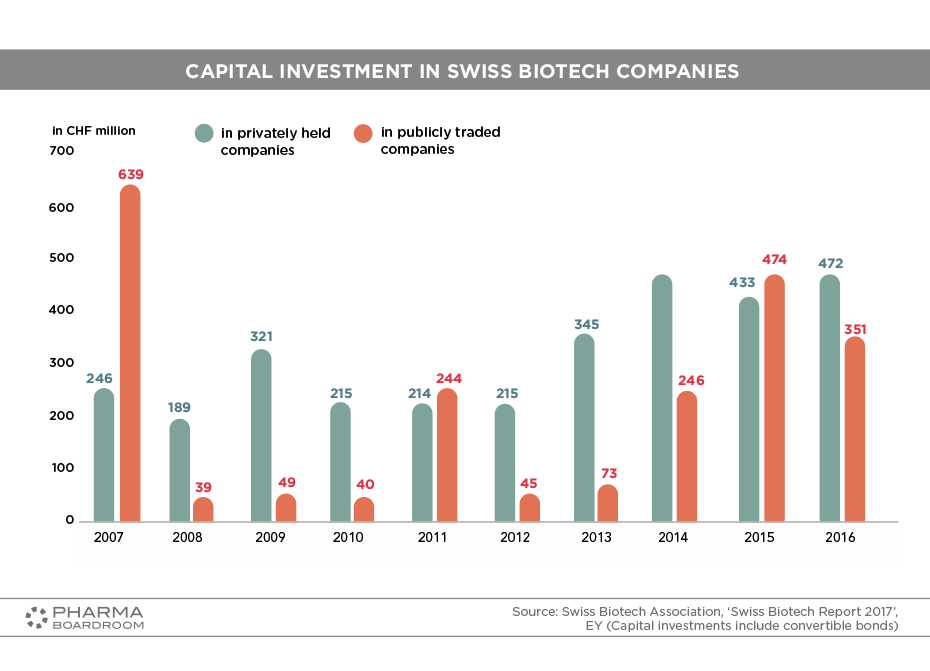
Switzerland scores highly in a global comparison of patent numbers and positioning.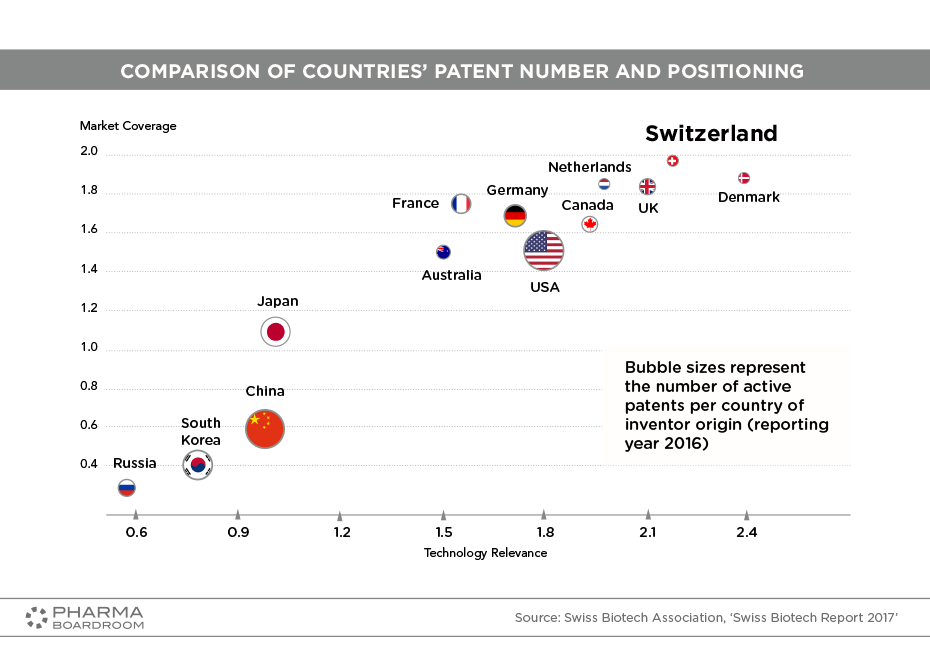
Pharma and biotech in the Greater Geneva area.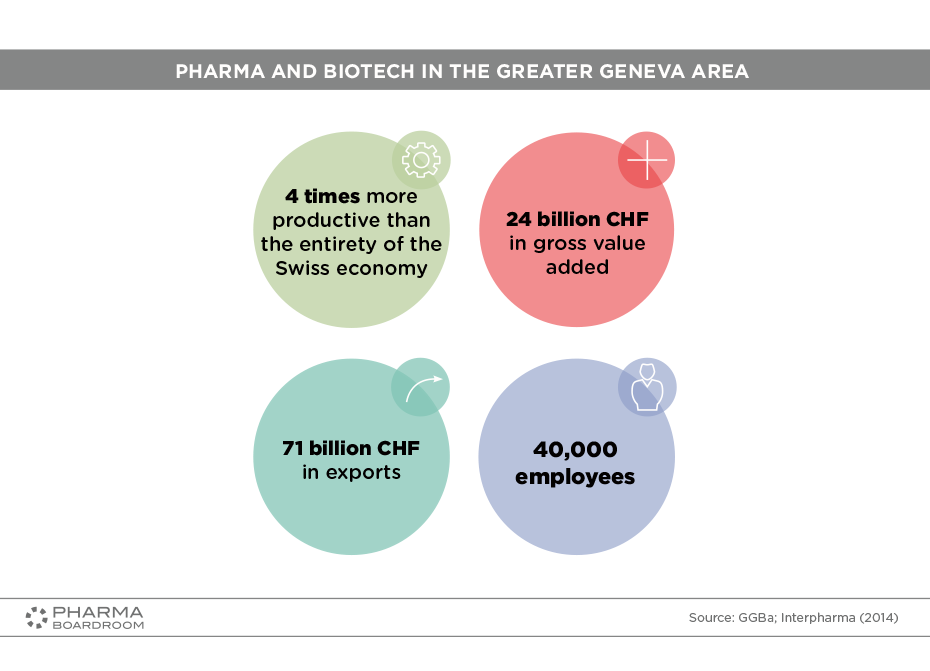
Facts and figures on the Greater Geneva Bern area health valley.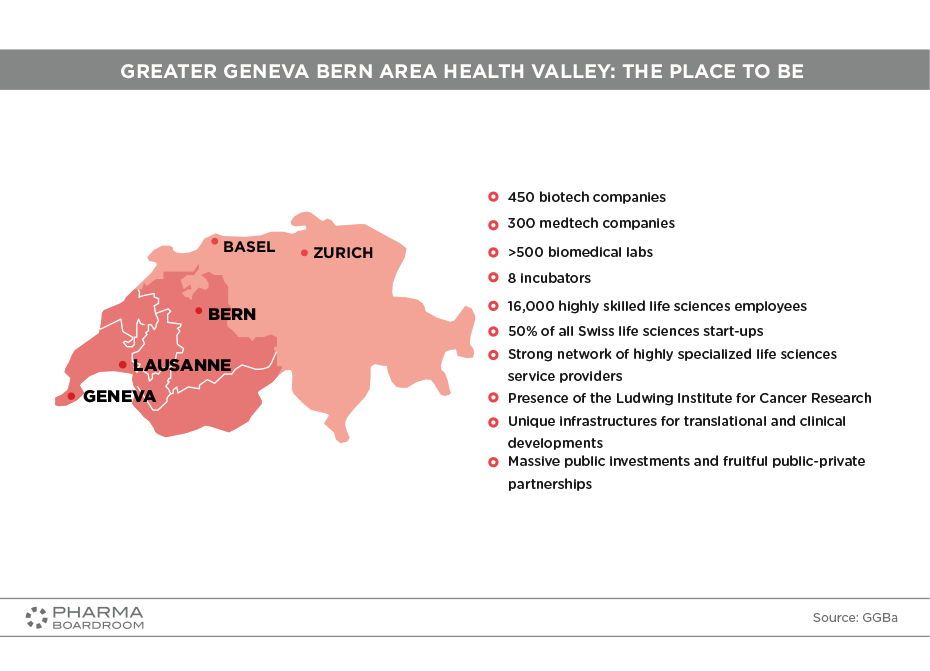
OTC Medicine outlets by market value.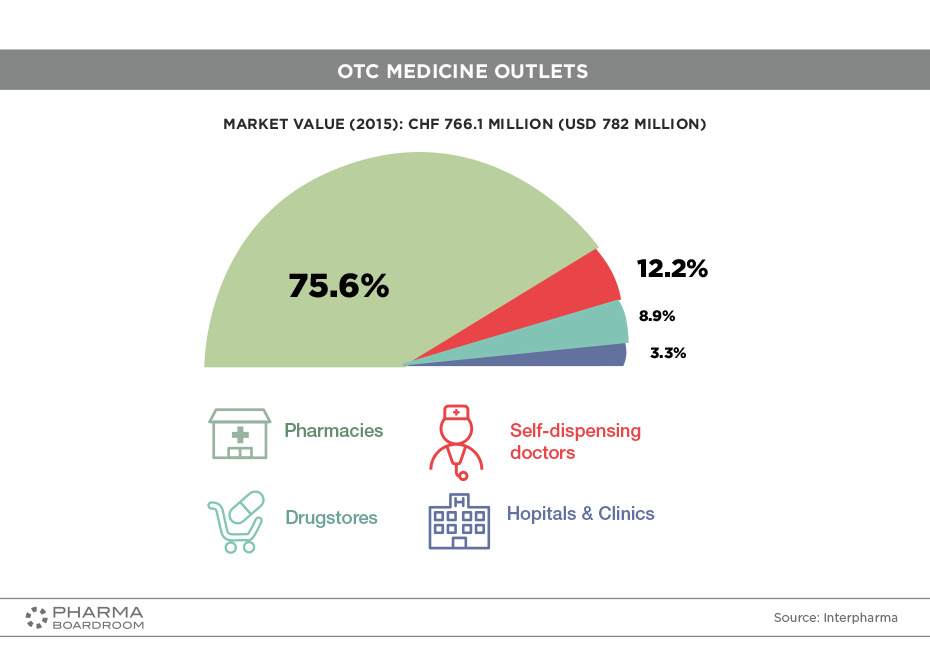
Number of employees in the Swiss biotech industry.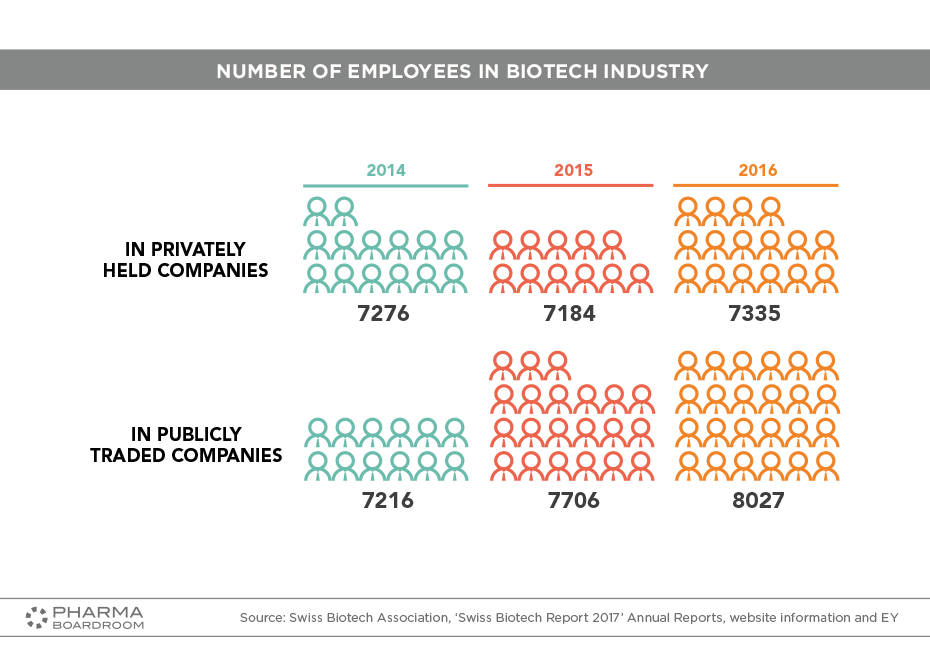
Publicly traded Swiss Biotech companies.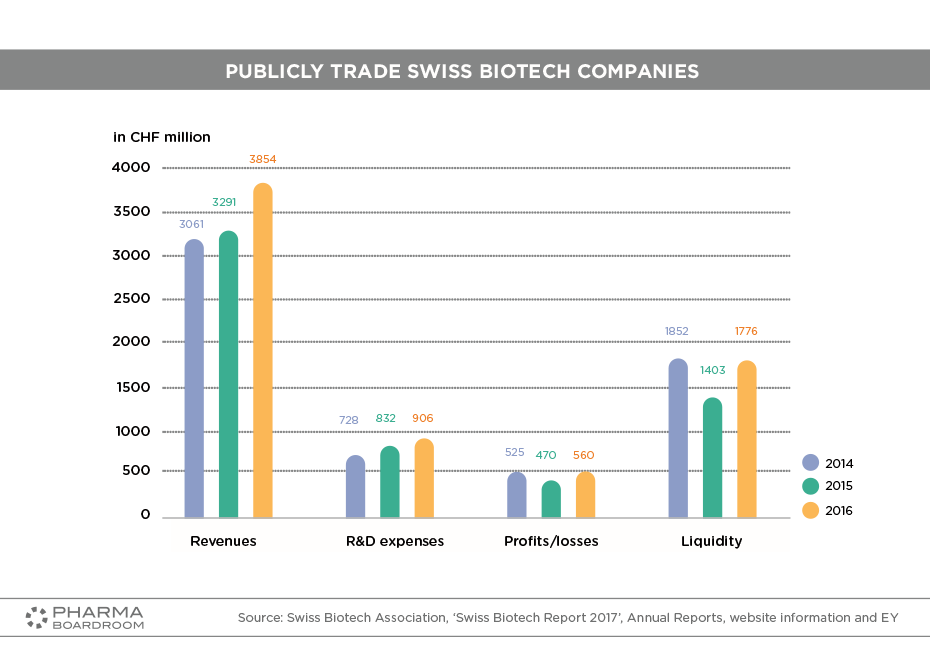
Privately held Swiss biotech companies.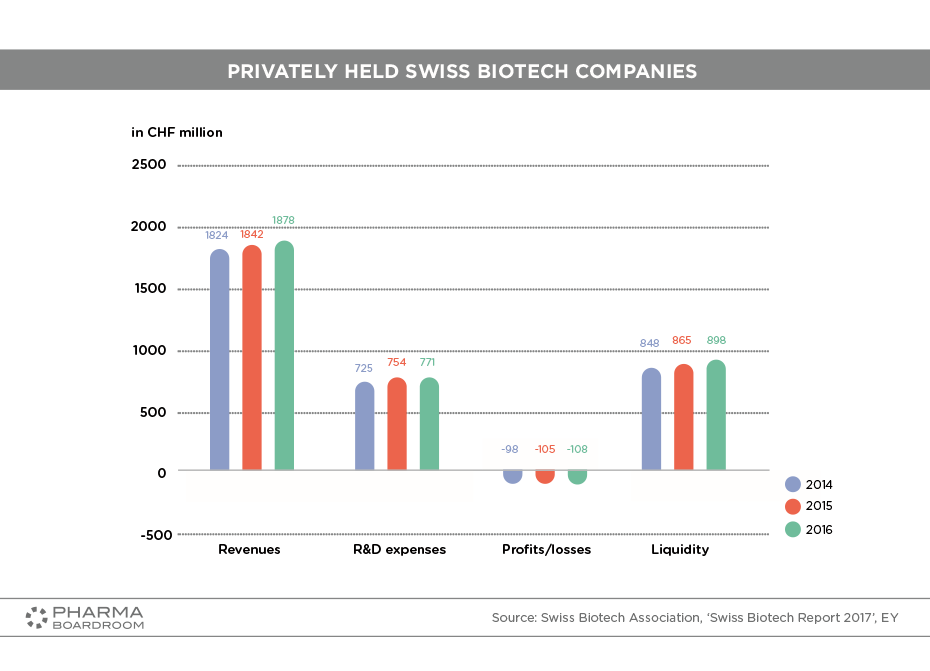
The pharmaceutical industry in canton Ticino.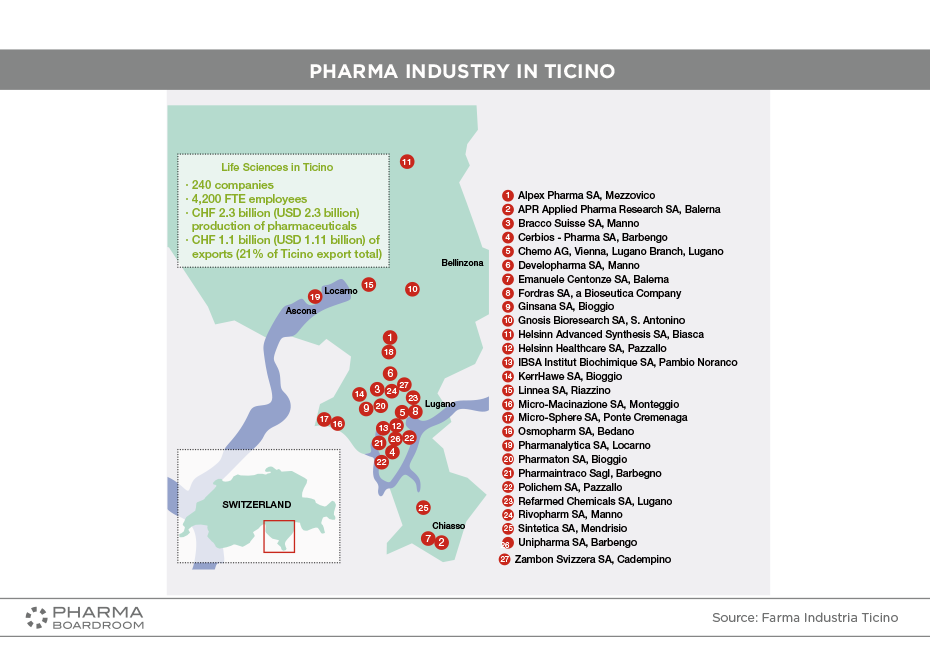